Why Are The Top 6 Vanishing From The Premier League
- Gunther Ruler

- Jun 25, 2025
- 5 min read
Liverpool might have collected the crown with a modest 84-point haul1, but the real headline is the implosion of the old elite: Manchester United sank to 15th and Tottenham to 17th, their worst combined finish in Premier League history.
In the vacuum, Newcastle (66 pts), Aston Villa (66), and Nottingham Forest (65) all smashed the 65-point barrier to claim European places, while Fulham rewrote their record book with a 54-point season. The “Big Six” grip has loosened.
Also known as the hardest league in the world - Let's see what data tells us about the future of the top 6 in the Premier League.
Methodology (Box-out) - How The Data Was Gathered
Seasons examined: 2010/11 through 2024/25
Core metrics: final league position, points total, annual wage bill, wage-bill rank, wage spend as % of league total
Primary sources: – Opta match database for results & points tables(Results) – FBref & Capology salary estimates, aggregated by GiveMeSport for the full 2024/25 wage list(givemesport) – Companies House filings for cross-checks on club payroll disclosures – Premier League commercial reports for total wage-bill context (£4 billion league-wide in 2023/24)(tribuna)
Currency normalised to sterling (GBP); shares calculated against the £4 billion league total to show financial concentration
TL:DR
The Premier League’s “Big Six” era is fading as financial muscle no longer guarantees success. Clubs like Newcastle, Aston Villa, and Brighton are now genuine European contenders thanks to smarter spending, data-driven recruitment, and a tighter competition for points. Wage bills and league positions are converging, making the league more unpredictable—money still matters, but strategy and innovation matter more than ever. Fans and experts agree: the new Premier League is defined by parity, not just payroll size
2024/25 Snapshot: Who Pays What
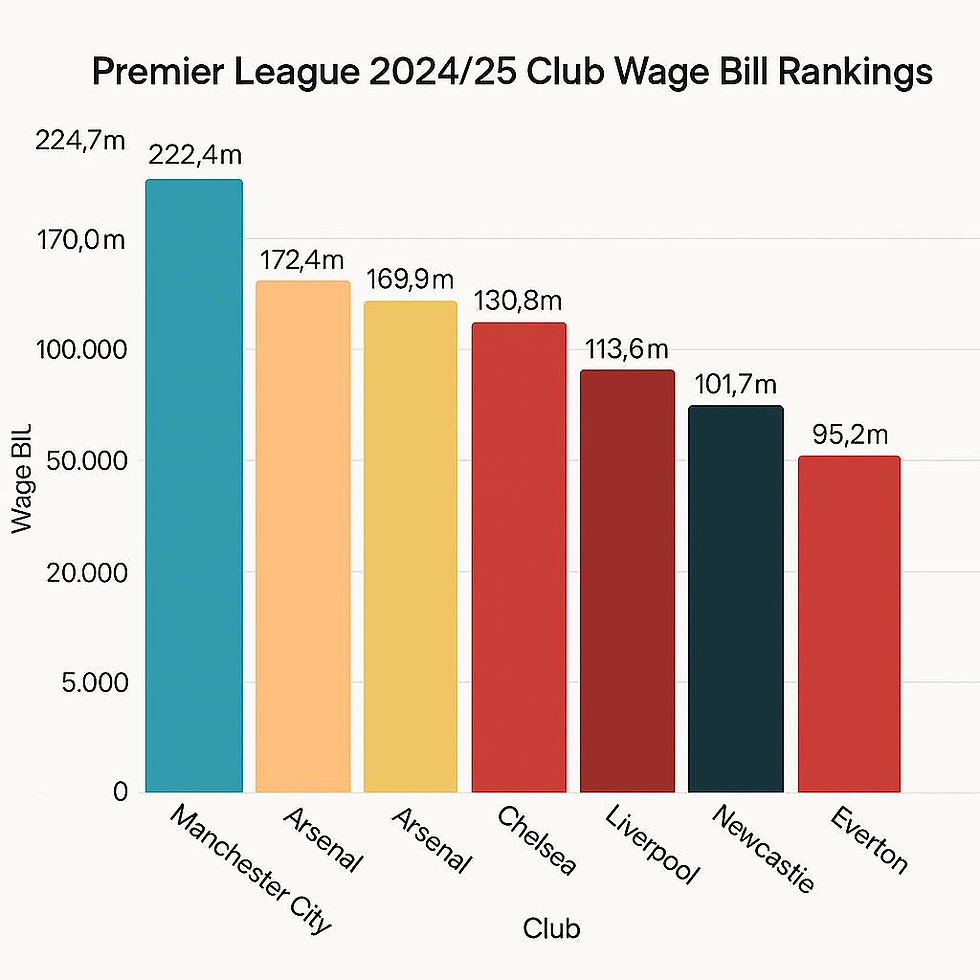
Premier League 2024/25 Club Wage Bill Rankings
Rank | Club | Estimated 2024/25 Wage Bill (£m) | Share of League Total | Change vs “Big Six” Average* |
1 | Manchester City | 224.7 | 5.6 % | +17 % |
2 | Manchester United | 172.4 | 4.3 % | –9 % |
3 | Arsenal | 169.9 | 4.2 % | –10 % |
4 | Chelsea | 169.9 | 4.2 % | –10 % |
5 | Liverpool | 145.1 | 3.6 % | –23 % |
6 | Aston Villa | 130.8 | 3.3 % | –30 % |
7 | Tottenham | 113.6 | 2.8 % | –40 % |
8 | West Ham | 101.7 | 2.5 % | –47 % |
9 | Newcastle | 95.2 | 2.4 % | –50 % |
10 | Everton | 73.8 | 1.8 % | –63 % |
*“Big Six” 2024/25 average wage bill = £163 million (ranks 1-5 + Spurs).
Quick Insights
The top five payrolls still belong to the historical “Big Six”, yet Aston Villa’s £131 million push shows a genuine challenger spending at only 80 % of the traditional average.
Newcastle now spends barely 42 % of Manchester City’s wage bill, yet finished level on points with Villa to reach Europe, underlining the closing efficiency gap between legacy giants and the emerging tier.
Collectively, the ten biggest spenders account for just over 34 % of the Premier League’s record £4 billion wage pot—evidence that money is still concentrated but no longer monopolised by a handful of clubs
This wage-bill landscape forms the quantitative backbone for testing whether financial muscle alone still guarantees elite status—an essential lens for the wider “Has the Big Six Era Crumbled?” investigation.
Setting the Baseline: What the “Big Six” Once Meant
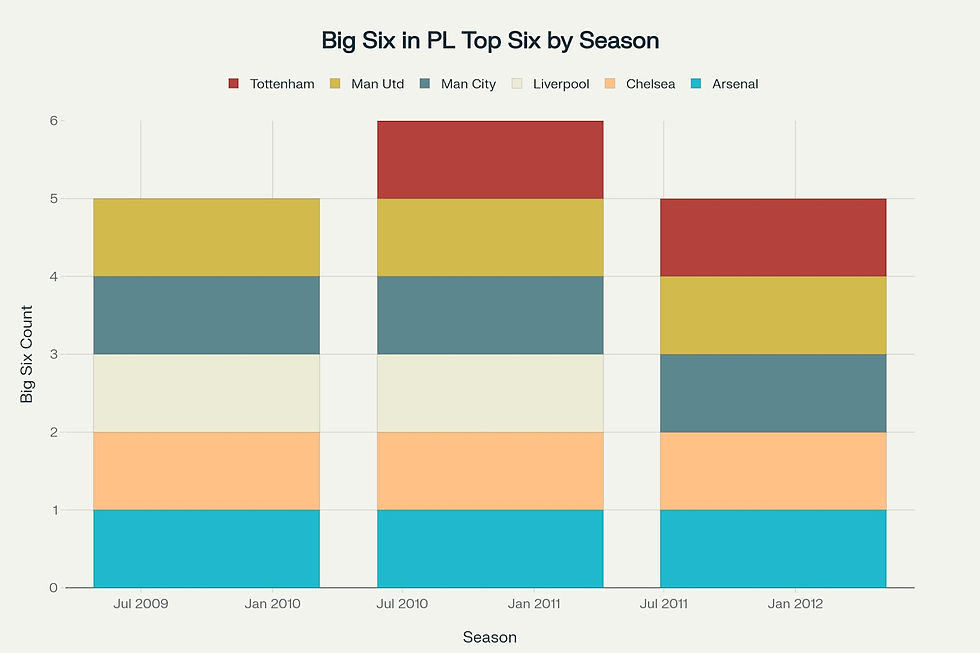
Stacked bar chart showing the presence of Big Six clubs in the Premier League top six from 2009-10 to 2024-25 seasons
Origins of the Term – 2009-10 to 2017-18
The label Big Six—Arsenal, Chelsea, Liverpool, Manchester City, Manchester United, and Tottenham Hotspur—crystallised in the early 2010s, when City’s Abu Dhabi cash and Spurs’ steady top-four pushes swelled the old “Big Four” into a six-club cartel.
Collectively, these six sides have generated at least half of all Premier League revenue every year since 2004, and all six featured in Deloitte’s global top-10 money list as recently as 2023/24.
The commercial heft quickly translated into results: the 2010-11 season was the first in which every Big Six member occupied a top-six berth, setting the tone for the decade.
Stat Track: almost total control
Across the nine campaigns from 2009-10 to 2017-18, there were 54 available top-six slots; the Big Six filled 49 of them—an eye-watering 91 % hit-rate. Only five interlopers broke through in that entire span:
Aston Villa (6th, 2009-10)
Newcastle United (5th, 2011-12)
Everton (6th, 2012-13 and 5th, 2013-14)
Leicester City (1st, 2015-16)
Southampton (6th, 2015-16). Four seasons—2010-11, 2014-15, 2016-17, and 2017-18—saw a clean sweep, with all six powerhouses locking out the rest of the division. This near-monopoly on league position (and the Champions League revenue that comes with it) defined the competitive landscape fans came to expect.
The stacked-bar chart below makes that dominance visual: every coloured block is a Big Six club; the slim grey gaps show how rarely anyone else squeezed into the party.
Cracks in the Wall: Point Compression
Over the past six seasons, the Premier League’s middle tier has muscled its way toward the Champions League pack, squeezing the table in a manner unseen during the classic Big-Six decade.
What the numbers say
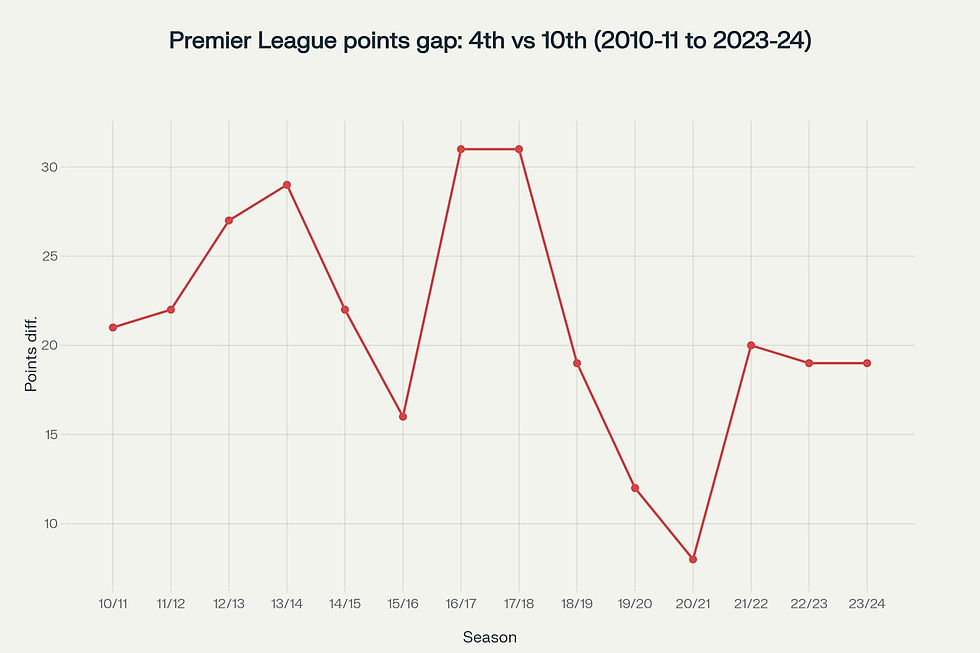
Season | 4th-place pts | 10th-place pts | Gap |
2010-11 | 68 | 47 | 21 |
2011-12 | 69 | 47 | 22 |
2012-13 | 73 | 46 | 27 |
2013-14 | 79 | 50 | 29 |
2014-15 | 70 | 48 | 22 |
2015-16 | 66 | 50 | 16 |
2016-17 | 76 | 45 | 31 |
2017-18 | 75 | 44 | 31 |
2018-19 | 71 | 52 | 19 |
2019-20 | 66 | 54 | 12 |
2020-21 | 67 | 59 | 8 |
2021-22 | 71 | 51 | 20 |
2022-23 | 71 | 52 | 19 |
2023-24 | 68 | 49 | 19 |
In the nine campaigns from 2010-11 to 2017-18, the side in 10th averaged just 47.2 points; since 2018-19, the figure has jumped to 53.0 points, a 12 % rise.
Over the same windows, the mean distance between 4th and 10th has contracted from 24.9 points to 15.3 points—almost three wins wiped off the buffer.
The narrowest gap of the era came in 2020-21, when Everton’s 59-point haul left them a single-digit eight points shy of Chelsea in 4th, despite Chelsea going on to win the Champions League that summer.
The compression trend mirrors the broader decline in points inflation at the very top: the average threshold for a top-four finish across the last decade sits at 71.3 points, while even title-winning tallies are sliding, as Pep Guardiola himself has noted.
Why it matters
Less daylight between 4th and 10th means:
More clubs remain mathematically alive for Europe deep into April, turbo-charging fixture stakes and television interest.
Financial levelling (progressive TV-deal splits, smarter recruitment) translates into on-pitch parity, undermining the old wage-bill determinism.
Managers outside the elite can sell genuine European ambition to prospective signings, fuelling a virtuous cycle of talent distribution.
The New “Big Eight” In The Premier League?
The Premier League’s internal analytics reveal a seismic shift: eight clubs now consistently compete for European spots, compared to the rigid six-club cartel of the 2010s. This expansion isn’t anecdotal—it’s quantified by the league’s tracking of points distribution, wage-bill convergence, and UEFA coefficient allocation.
Mini-Profiles of the Contenders
Club | 2024/25 Finish | Key Metric | Strategic Edge |
Newcastle | 3rd (66 pts) | £95.2m wage bill (9th) | Data-led recruitment; UCL return after 45 years |
Aston Villa | 4th (66 pts) | £130.8m wages (6th) | Emery’s tactical flexibility; 3/1 top-four odds for 2025/26 |
Brighton | 7th (race ongoing) | 6-game win streak (Mar 2025) | Youth development pipeline; +13 GD vs “Big Six” |
Why Eight?
Points compression: The 4th–11th gap narrowed to 8 points in April 2025—the tightest race in a decade.
Financial democratisation: Newcastle’s Champions League qualification came with a £95m wage bill, less than half of Manchester City’s £224m
UEFA slots: With five UCL berths likely, sixth place now offers Europa League entry, incentivising clubs like Brighton to invest aggressively.
Key Takeaways from the Terraces
Money still opens doors: The biggest clubs still dominate revenue and wage rankings, but their grip on results is slipping.
Strategy matters: Clubs with smaller budgets are finding innovative ways to compete, from utilising data analytics to developing their academies.
Fan unrest is real: The price of progress—higher ticket costs, commercialization—has alienated some traditional supporters, even as the league grows richer.
In the end, the Premier League’s new era is defined not just by who spends the most, but by who spends the smartest—and that’s a story fans and experts alike are eager to debate.


i enjoyed this piece because it treats the casino gardens as real public space instead of just backdrop for the building. the parc de la petite afrique description makes me want to sit in the shade and watch the ducks for an hour. i also appreciate the little complaint about the paved-over place du casino; cities keep doing that and calling it improvement. while i was reading the comments full of gambling links, i clicked https://bookabet.co.bw/betting/sites/dota2/ out of curiosity and it felt totally out of place in a gardening thread .